04 · CHOKEPOINT
Strait of Hormuz.
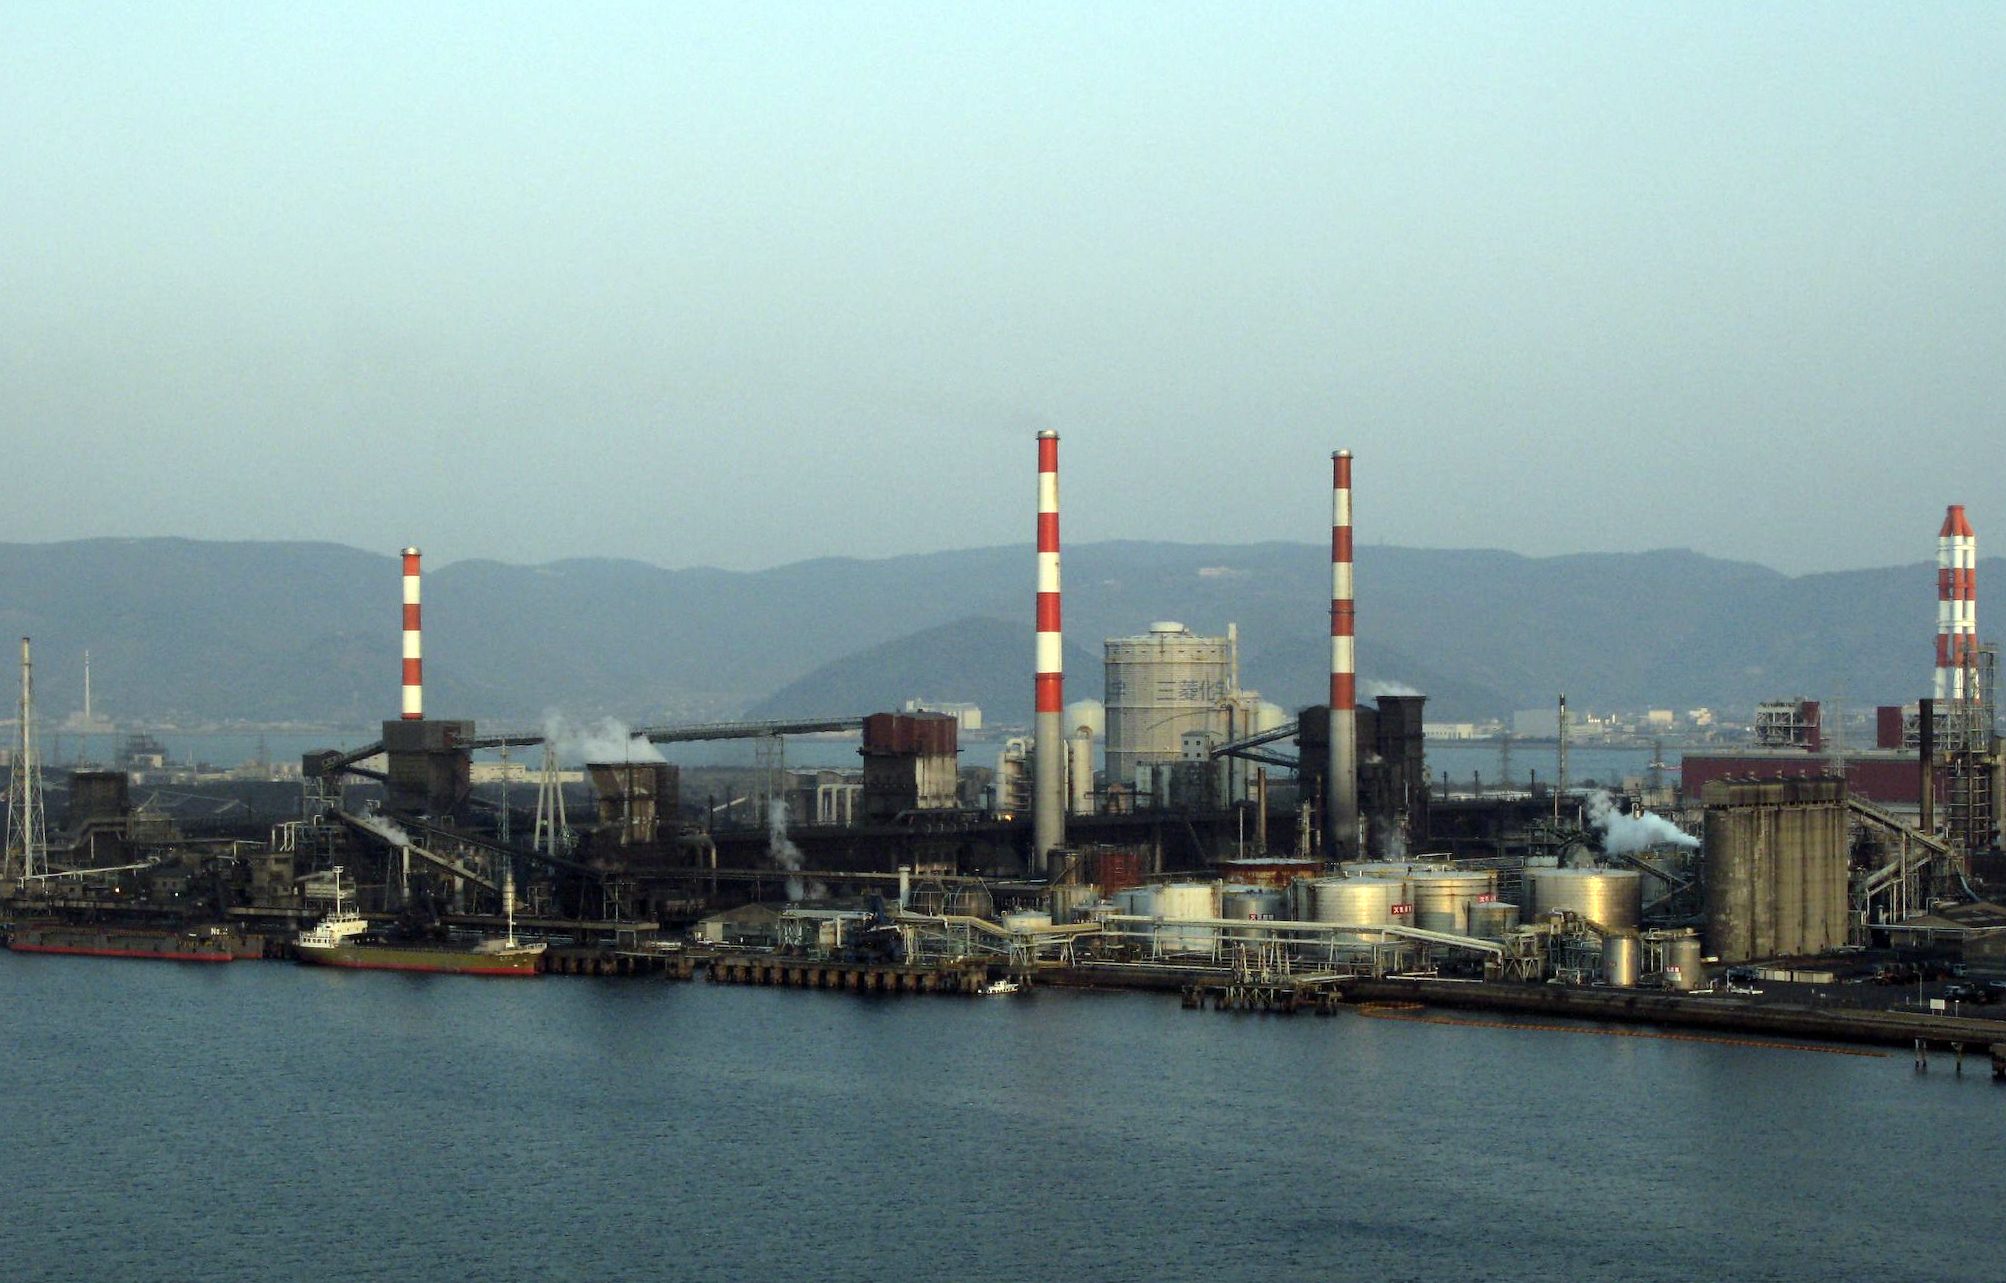
A fifth of world oil and a third of seaborne LNG transit this narrow gate daily. When σ crosses threshold, Japan's naphtha chain breaks first.
A dimension of sovereign risk that moves before credit markets notice. Derived from physical flows, reserve days, and chokepoint geometry — never from sentiment or spreads.
Reserve days and import dependency ratios cannot be falsified. Models built on sentiment surveys and credit spreads can. REWF uses only the former.
Each indicator is derived from observable flows and stocks — no price-based proxies, no sentiment surveys. Values propagate through the pipeline; every formula is published.
Share of world energy resources not freely accessible. Trade concentration (HHI) + price discount vs Brent across 40 supplier nations. Cause-agnostic, market-observable.
Vulnerability to external resource loss. Three pillars — Energy, Industrial feedstocks, Food. Alliance protection (φ_bloc), political-decision constraint P, and extended τ composing stock with flow.
Three outputs per scenario — PDD (days until binding constraint depletes), SVE (sovereign value evaporated), Gap Score (rating blind spot). Validated against 18-year backbone of 4,613 trading days.
Conflict intensity decomposed across 8 route segments (Hormuz, Bab el-Mandeb, Gulf of Oman, Indian Ocean West, Mozambique Channel, Cape, Malacca, Suez). AIS transit ratios, news-filtered, manual override.
Full methodology published. Every formula, every data source, every assumption.
Read the Framework Paper →Chokepoints, carriers, terminals, tankers — the objects whose flows and stocks the framework tracks.
A fifth of world oil and a third of seaborne LNG transit this narrow gate daily. When σ crosses threshold, Japan's naphtha chain breaks first.
The second-most exposed chokepoint for East Asian economies. Demand-destruction kernels here cascade differently than Hormuz — the framework separates them.
Every loaded crude carrier is a unit of the Depletitude denominator. When transit concentration rises, HHI rises, Dopt rises — and credit markets have nothing to say about it.
Iran's primary export node — a physical object whose state is a direct input to the HHI trade-concentration calculation in Depletitude.
Sortie readiness is observable and quantifiable. It feeds σ as one of three independent streams, alongside pricing and event classification.
A 187 m crude oil tanker in service. Every such vessel at sea is a node in the physical supply graph that the framework tracks, not an abstraction.
Depletitude operates at basin scale — HHI and price discount are measured across the whole access surface, not a single port. The satellite view is the unit of analysis.
Three exhibits, ordered by how the physical cascade propagates: currency stress first — the visible surface — then the supply-chain fracture beneath it, and finally the government narrative that denies both.
Documented by AU, UNDP, and UNECA. Each step occurred exactly as the REWF framework predicts when σ crosses threshold and Severitude lacks a protective bloc.
Japan's Severitude has been at the L5-transition threshold continuously through the 12-Day War (2025-06), Epic Fury (2026-02-28), and the Hormuz closure declaration (2026-04-12). The framework's binding-constraint flag for naphtha-derived products fired ahead of Fukubi's restriction announcement and ahead of the strategic reserve release reaching general media.
Physical-quantity indicators lead market-narrative reaction. The V4.5 18-year backbone shows this leading-indicator behavior on 93.93% of 4,613 trading days.
The headline "four months" figure aggregates across fuel reserves. The binding constraint — naphtha-derived products such as nitrile gloves — runs through a conversion chain that has already fractured. REWF's τ function quantifies precisely why aggregate reserve days mislead under stress, and why the binding-constraint view is the operative diagnostic.
Sovereign wealth funds, pension systems, and central bank reserve managers. Scenario analysis grounded in physical constraints.
Continuous access to the full REWF surface — Depletitude, Severitude, PDI, σ proxy — with scenario decomposition by chokepoint.
Commissioned analysis for a named sovereign and a named scenario. Delivered as a peer-reviewable PDF with supporting data.
Every other Monday. One page. Severitude movement, σ proxy trends, Gap Score rankings, Narrative-Reality Gap. No fluff.
Reserved for institutional readers. No list-sharing.
Full methodology published. Every formula, every data source, every assumption. If the model is wrong, anyone can demonstrate it.
V4.5 retains the V4.3 mathematical structure — buyer-specific D_opt(c) under orthogonal W/Π/λ/P constraints, segment-decomposed σ, extended τ — and adds production-grade calibration: a unified data source where the live API equals the historical CSV at every date, an 18-year backbone of 4,613 trading days (2008–2026), 40-nation supplier coverage (Tier 1 + Tier 2), the Stock-Only Endurance Model v5 with METI primary-source inventory, AIS-based departure tracking, and the Narrative-Reality Gap. For Japan in May 2026, D_opt(JP) ≈ 8.62 against a global 4.57. The 18-year backbone reveals that physical prices led media narrative on 93.93% of trading days.
Open methodology. Every formula, every parameter, every calibration. Data sources: yfinance (Brent / WTI / NG / grain futures), UN Comtrade, METI 「資源・エネルギー統計」 / PAJ primary statistics, AIS transit observations (VesselFinder Recent Departures from 25 Mid East ports), event classification pipeline.
The Institute produces indicators grounded in physical quantities — not sentiment, not ratings, not narratives. The framework measures one question: can this nation physically function under stress?
Black-box risk models built on surveys and spreads failed in 2008 and again in 2024. REWF is the opposite pattern: every input observable, every assumption documented, every formula published.

Independent geopolitical analyst and Chief Systems Architect. Based in Nagoya, Japan. Single-handedly designs and implements machine learning pipelines, automation infrastructure, and analytical platforms. Architect of REWF — a sovereign risk assessment framework that quantifies physical resource access constraints.

An independent technology entity based in Nagoya, Japan. Built around three pillars — AI systems design, geopolitical risk analysis, and automation infrastructure — committed to constructing independent intellectual infrastructure under the banner "Pioneering the Future of Intelligence."

The data, analysis, and indicators provided by REWF Institute do not constitute investment advice. Investment decisions are the sole responsibility of the user. REWF indicators analyze physical supply structures and are not designed to predict market prices, credit spreads, or exchange rates.
Input data sourced from public market data (yfinance, UN Comtrade), government statistics, and event classification pipelines. Models contain assumptions and limitations documented in the framework paper. Institutional clients receive a reproducibility appendix on request.
Dashboard demonstration, custom sovereign analysis, or framework-level discussion. Reply within one business day.
Register for Briefing →